Time to Market Reduction for Marketing Teams in 2026

The AI CMO team
Oct 25, 2026
The popular advice says faster content generation equals faster launches. That advice is wrong for most marketing teams. Copy rarely sits unfinished for two weeks. Campaigns sit unapproved, unsegmented, or unchecked for consent for two weeks, and another generation tool does nothing for that queue.
Real Time to Market Reduction starts later and ends later than most dashboards admit. The clock should run from an approved brief to a compliant, measurable launch. Governance, consent checks, and data readiness aren't obstacles outside that clock. They're where the clock is won or lost.
Table of Contents
- What Time to Market Reduction Means for Marketing
- Time to Market Benchmarks Worth Knowing
- Why Faster Launches Pay Off Commercially
- KPIs That Show Whether Launches Are Getting Faster
- Blockers That Quietly Stretch Launch Cycles
- Six Moves to Shorten Launch Cycles, Starting This Week
What Time to Market Reduction Means for Marketing
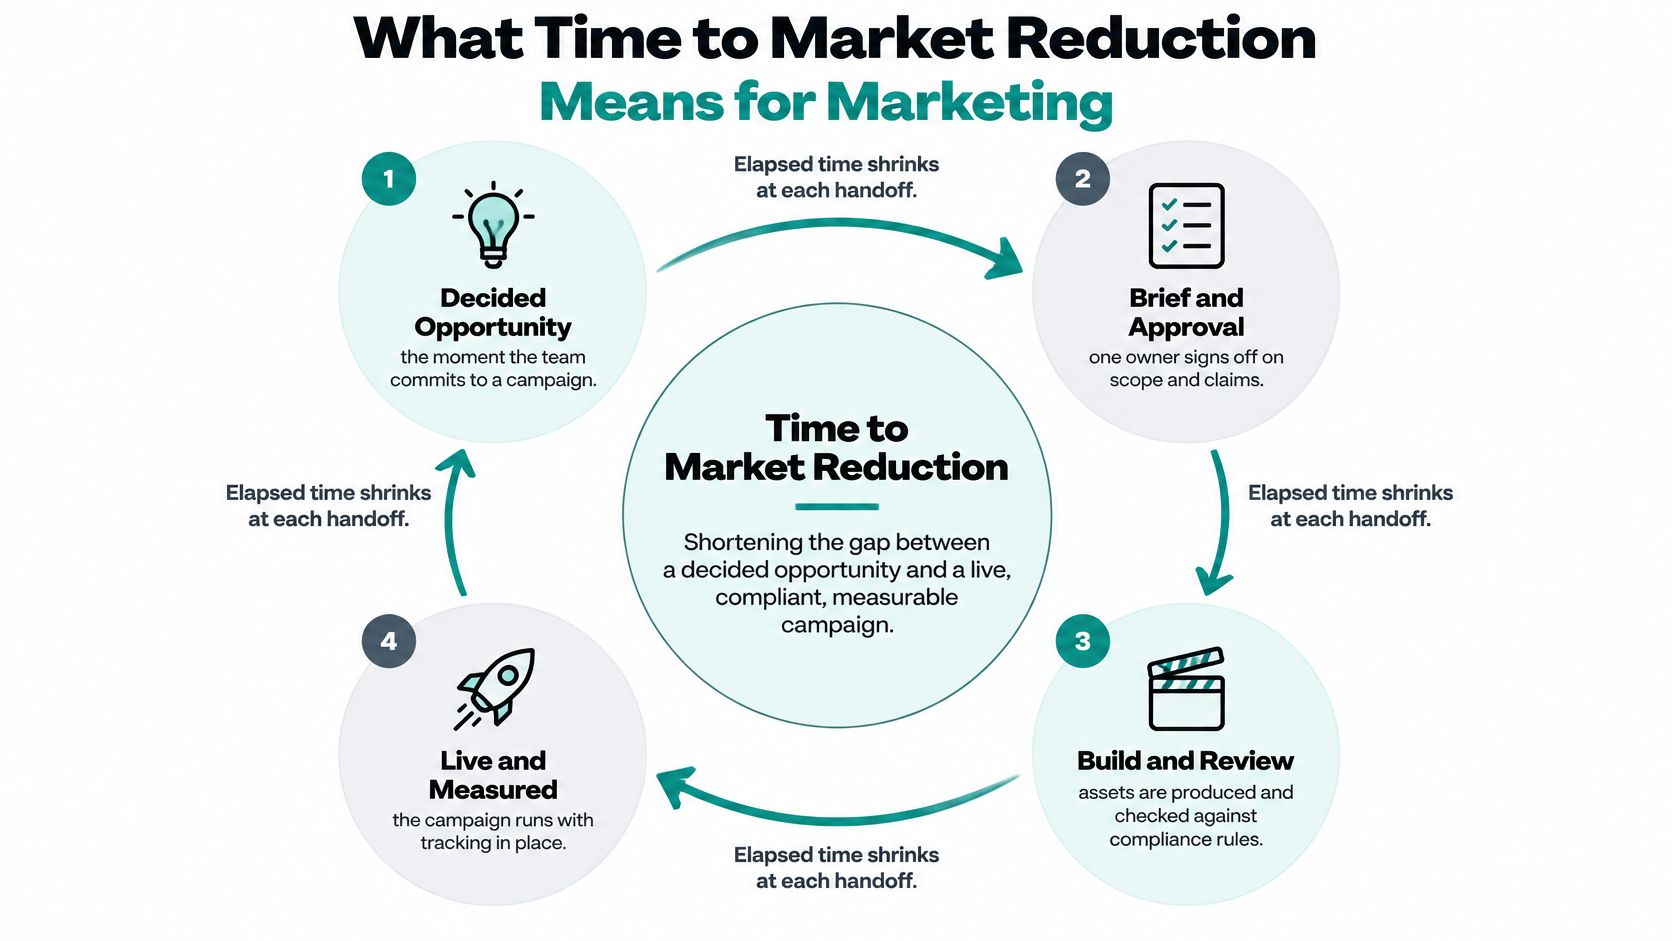
Time to Market Reduction is the deliberate shortening of elapsed time between a decided marketing opportunity and a live, compliant, measurable campaign. It's not a productivity slogan. It's a calendar measurement, and calendar time doesn't care whether a delay came from hard work or an unread inbox.
Think of a relay race. Spectators blame slow runners, but races are lost in the handoff, when the baton waits in someone's hand. Marketing launches work the same way. The writer, designer, and media buyer may each move quickly while the campaign as a whole crawls.
Where the Clock Starts and Stops
The clock starts at the approved brief, not when a designer opens a file. That choice matters because it puts the whole chain on the record: insight, brief, production, approval, data check, activation, and measurement setup. A team that starts timing at first draft will congratulate itself while hiding its longest waits.
The clock stops when the campaign is live with tracking in place and suppression applied. A send that goes out without working attribution isn't a launch. It's an expense with no evidence attached.
The formula stays simple:
- Time to market: Live date minus approved-brief date, expressed in days or weeks
- Working time: Days someone actively builds, writes, or configures
- Waiting time: Days the work sits idle between owners
A Worked Example Worth Copying
Consider an illustrative email launch for a seasonal offer that took 19 days end to end. Copy took two of those days. Brand and legal sign-off consumed eleven, split across reviewers who each assumed someone else held the pen.
Nobody on that launch was slow. The handoffs were. Splitting the nineteen days into working and waiting exposes the fix in minutes, and it isn't a faster writer.
Reduction doesn't mean working weekends or skipping quality checks. It means removing idle days that add cost without adding judgment.
The practical test is straightforward. A marketing leader should be able to draw a timeline of the last three launches and label exactly where the baton waited. If that drawing can't be produced from timestamps, the team doesn't have a speed problem yet. It has a visibility problem, and visibility comes first.
Time to Market Benchmarks Worth Knowing
Marketing teams rarely publish a shared time-to-market benchmark, so industrial and enterprise studies offer useful reference points, not campaign targets. The relevant clock runs from an approved brief to a compliant, measurable launch. That includes governance, consent, data readiness, and tracking setup. Faster production alone does not make a campaign ready to go live.
Accenture's cross-industry study of 1,200 experts across 13 countries examines industrial companies. It reports average time to market falling from 57 weeks in 2016 to 41 weeks in 2021, a reduction of 16 weeks, or 28.1%. The study projects a further decline to 29 weeks in 2026, about 49% below the 2016 figure.
Those are industrial-sector results, not marketing cycle times. Still, the scale is instructive. Sixteen weeks can span a selling season. For marketers, the lesson is to measure the full route from signed-off brief through approvals, data checks, and launch readiness, rather than counting only the hours spent creating assets.
| Benchmark | Baseline | Later figure | Reported reduction |
|---|---|---|---|
| Industrial companies average (Accenture) | 57 weeks in 2016 | 41 weeks in 2021; 29 weeks projected for 2026 | 16 weeks (28.1%) by 2021; about 49% by 2026 |
| Agile operating model across organizations (McKinsey) | Pre-transformation operating model | Agile operating model in place | At least 40% reported |
| Response to a competitor's new-product release (McKinsey) | Several months | One week | As much as 70% |
| Microsoft-commissioned study, 2024 (Microsoft) | Businesses before reported change | Businesses after or expecting change | 27% of businesses reported or expected an 11% to 15% improvement |
How to Read These Numbers Without Fooling Anyone
Report weeks and percentages together, with weeks first. A percentage without its baseline can make a small change look dramatic, while time saved shows what capacity the team actually regains.
Accenture also reports declines between 2016 and 2021 across industrial segments: industrial and electrical equipment fell from 52 to 38 weeks, industrial suppliers from 56 to 44 weeks, and heavy equipment from 60 to 44 weeks. These figures show progress across different parts of the industrial sector, but they do not establish how quickly marketing campaigns should launch.
McKinsey's research on enterprise agility indicates time to market could fall by at least 40% under an agile operating model. It also reports 30% to 50% improvement in operational performance and 20% to 30% cost savings. Treat the time reduction as an ambitious reference point, not a forecast for a marketing team. Changing the operating model can change handoffs; buying a tool while preserving every approval queue cannot.
One company in the McKinsey research cut its response to competitor product releases from several months to one week, a reduction of as much as 70%. For marketing, that kind of speed depends on more than fast creative production. Consent, usable data, and clear approval ownership need to be ready when the brief is approved.
At a more modest level, a 2024 Microsoft-commissioned study found 27% of businesses reported or expected an 11% to 15% improvement in time to market for new products and services.
Use these studies to frame questions, not to claim your campaign team matches an industrial benchmark. Set a baseline from actual launches, measured from approved brief to compliant, tracked release. The agile operating-model finding is especially relevant: campaigns rely on coordinated work across strategy, creative, data, compliance, and channels. A launch is faster only when those pieces are ready together.
Why Faster Launches Pay Off Commercially
A launch is commercially fast only when it moves from approved brief to compliant, measurable release in time to influence a customer decision. Shortening production alone does not create revenue. Teams also need consent, usable data, and approvals ready before the buying window closes.
Delivery maturity is evidence about execution, not proof that faster launches cause higher revenue. Google's synthesis of State of DevOps research reports that organizations with elite delivery capability are more than twice as likely to meet or exceed business goals. The research connects delivery performance with profitability, productivity, market share, customer growth, and satisfaction. For marketing, the practical lesson is to make launches reliable as well as quick, so teams can act on an opportunity and measure what happened.
Personalization research shows the commercial value of relevant customer experiences, not the revenue effect of shorter launch cycles. McKinsey's explainer on personalization reports that personalization can reduce acquisition costs by as much as 50%, increase revenue by 5% to 15%, and improve marketing ROI by 10% to 30%. These are personalization outcomes. Faster launch processes can help teams deliver relevant offers while intent is active, but the figures do not isolate speed as the cause.
The Cost of Arriving Late
McKinsey's 2021 personalization research found that companies growing faster by revenue derived 40% more of their revenue from personalization than slower-growing companies. That finding describes an association between personalization and growth, not proof that speed or personalization alone caused it. The lesson for operations leaders is to build repeatable execution, rather than treating individualized campaigns as occasional exceptions.
Late, generic outreach is a clear operational problem. In Salesforce's 2026 State of Marketing survey of 4,450 decision-makers, 69% of marketers struggled to respond promptly to customers and 84% still ran generic campaigns. Consent checks and data readiness belong in the launch path: skipping them risks sending an irrelevant or noncompliant message, while resolving them early helps teams act on customer signals.
A seasonal offer that goes live after its buying window reaches a smaller, less engaged audience. The production cost remains, while the opportunity shrinks. Measure speed against commercial outcomes, including acquisition cost, retention, and return on spend. A faster launch is valuable when it reaches the right customer in time and can be evaluated after release.
KPIs That Show Whether Launches Are Getting Faster
Software delivery solved this measurement problem years ago, and marketing should borrow the answer. DORA's delivery metrics define change lead time as elapsed time from a code change being committed until it's successfully running in production, while deployment frequency, change-failure rate, and failed-deployment recovery time capture throughput and stability together.
Translated into marketing terms, change lead time becomes brief-to-live lead time. Deployment frequency becomes launches per week. Change-failure rate becomes the share of launches needing correction, and recovery time becomes the hours needed to fix a broken send or page.
| KPI | Marketing definition | How to capture it | Watch for |
|---|---|---|---|
| Brief-to-live lead time | Days from approved brief to first live send or post | Timestamps in planning tool and campaign platform | Averages hide slow outliers; track median and p95 |
| Creative approval cycle | Hours from first draft to final sign-off | Approval log with timestamps per reviewer | Revision loops inflate the number |
| Segment-refresh-to-activation | Time from a data change to an audience ready to send | Segment refresh and activation events | Stale profiles cause silent targeting errors |
| Launch frequency | Campaign or asset releases per week, by channel | Count of live launches by channel | More launches do not equal more value |
| Change-failure rate | Share of launches needing rollback, correction or suppression fix | Incident and correction log | Count suppression errors as failures |
| Recovery time | Hours to fix a broken send, landing page or journey | Incident open and close timestamps | Slow fixes cost more than slow launches |
| Incremental business impact | Revenue, retention or acquisition cost change per launch | Attribution against control or holdout groups | Last-click attribution overstates fast launches |
Reading the Scorecard Correctly
Speed metrics alone will mislead. The balanced approach pairs flow metrics with outcome measures such as incremental revenue, conversion, retention, and support deflection, so a team can't win by shipping mediocre work at impressive velocity. Strong marketing workflow management makes that pairing routine rather than a quarterly archaeology project.
Averages conceal the true problem. A small number of delayed approvals, data ingestion failures, or compliance checks can dominate actual launch dates while the average looks respectable. Track median and p95 lead time side by side. The median shows the typical launch. The p95 shows the launch that missed the season.
- Progress rule: A lower median and p95 counts as progress only if failure rate and recovery time hold steady
- Segment rule: Break results down by channel and workflow type, since email and paid media rarely stall in the same place
- Baseline rule: Establish brief-to-live, creative-approval-to-send, segment-refresh-to-activation, and incident-recovery intervals before changing anything
Cadence keeps the numbers honest. Review flow metrics weekly, while the waits are still correctable. Review outcome metrics monthly against holdout groups, because revenue signals need time to separate from noise. A team that reviews speed weekly and value never will get very fast at producing work nobody can justify.
Blockers That Quietly Stretch Launch Cycles
A launch can look fast on the production board and still stall between an approved brief and a compliant, measurable release. The usual delays sit in approval queues, disconnected customer data, unclear decision rights, and late compliance checks. Treating governance and data readiness as speed levers exposes where the time actually goes.
A 2025 global survey of 300 marketing decision-makers found 85% reported using generative AI, while only 15% said it was fully integrated into daily workflows. Governance confidence was also limited: 79% felt somewhat confident, but fewer than 10% were strongly confident in their organization's marketing AI governance. Faster content generation does not by itself shorten the journey to launch. Teams need clear review ownership, usable customer data, and checks that happen before the release deadline.
| Blocker | Where it shows up | Baseline to measure |
|---|---|---|
| Governance and approval queues | Assets wait for review without a clear decision owner | Review latency and revision rate per asset |
| Fragmented customer data | Audiences are rebuilt by hand for each campaign | Time from data availability to audience activation |
| Siloed service, sales and commerce data | Campaigns cannot respond to recent customer actions | Share of records eligible for use |
| Compliance and suppression gaps | Consent or suppression errors surface late | Compliance exceptions per 100 launches |
| Disconnected tools | Teams copy information between planning, creative and sending tools | Handoffs per launch |
| Unclear ownership | Decisions escalate beyond the person who owns the brief | Decision count and escalation time per launch |
Governance Queues and the Data Trap
Approval queues are a practical place to investigate: they make waiting visible and reveal whether decisions have an owner. Teams can simplify publishing approvals with Taja AI. Well-defined content approval workflows assign each asset an owner and a response window, replacing the shared inbox where requests can sit without a decision.
Data readiness can delay the first launch because identity resolution, mapping, and consent validation take work. Skipping those checks shifts the burden into later campaigns, where teams reconcile records, correct targeting, or rebuild audiences. Adobe's 2025 Australia and New Zealand research found 82% of brands said siloed online and offline data hindered real-time personalization, while 59% identified governance, compliance, and privacy as major barriers to scaling AI. Those findings make data readiness part of launch speed, not a separate cleanup project.
Measure the full interval, from approved brief to compliant, measurable launch. A quick first release is not a win if it depends on consent gaps or creates repeated rework. The better test is cumulative launch time across six to twelve months: invest in sound data and governance early, then track whether later launches move with fewer delays and corrections.
Integration is another constraint. The SAS document reports that IAB research found only 30% of agencies, brands, and publishers had fully integrated AI across the media campaign lifecycle. That reported figure points to limited integration across campaign work, not proof that teams bought tools without connecting them. Before adding production capacity, ask: Where did the last launch wait longest, and who owned that decision? If the answer is unclear, start by recording the wait and naming the decision owner.
Six Moves to Shorten Launch Cycles, Starting This Week
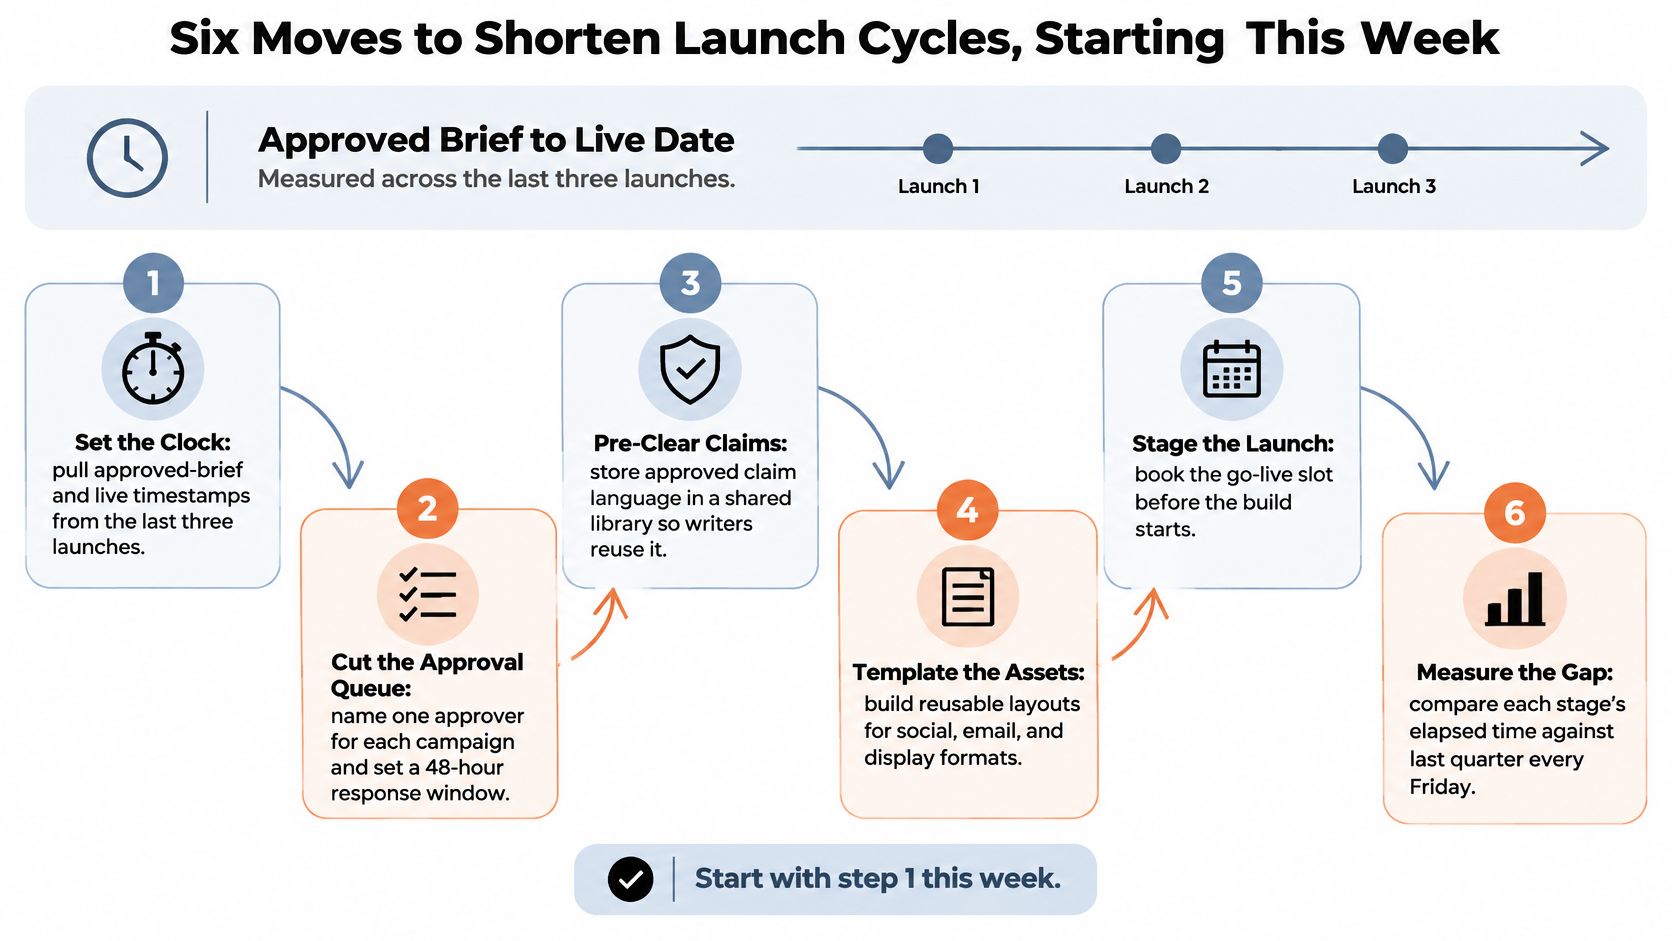
Start with the clock: approved brief to live date, measured across the last three launches. Everything below either shortens that interval or protects the quality of what ships inside it. Nothing else earns a place on the list.
The six moves follow a deliberate sequence, from measurement through governance to automation.
Moves One and Two Fix Visibility and Approvals
1. Set the clock. Pull approved-brief and live timestamps from the last three launches and mark where the baton waited. Split each timeline into working, waiting, and rework time. Many teams discover the production work they planned to accelerate was never the bottleneck.
2. Sort approvals by risk. Not every asset deserves the same scrutiny, and treating a template email like a regulated claim wastes reviewer attention where it matters least. Brand-approved templates should go live without fresh review. Paid media, regulated claims, and new audiences get named approvers through configurable human approval rules, with response windows attached. Risk-tiered approval isn't weaker governance. It's governance aimed at the work that can cause harm.
Moves Three and Four Fix Data and Production
3. Unify customer context. Connect sources through Data 360 and Customer 360 so profiles, consent status, and segments refresh automatically instead of being rebuilt per campaign. Expect the first launch on unified data to run longer while mapping and consent checks finish. That upfront cost buys back time on every launch after it, because audience building stops being a manual project.
4. Let AI specialists propose and execute within limits. The pattern that works is bounded autonomy: specialists propose weekly plans, humans approve what matters, and approved work executes without further coordination overhead. Studios turns briefs into emails, landing pages, and ads inside the same environment, so production stops waiting on file transfers between tools. Done well, agentic workflow automation earns its keep by compressing the distance between an approved idea and a finished asset.
One factual option in this category is The AI CMO, which combines AI specialists that propose weekly plans, Studios for asset production, Customer 360 profiles, and Journeys for cross-channel execution in one system. Teams evaluating any platform should judge it the same way: does it shorten brief-to-live time measurably, or does it just generate drafts into the same old queue?
A short walkthrough shows what bounded execution looks like in practice, from plan proposal through scheduled publishing and reporting.
Moves Five and Six Fix Execution and Learning
5. Trigger Journeys instead of rebuilding campaigns. Behavior-based sequences across email, SMS, push, and WhatsApp reuse segments and approved assets, so a response to customer action doesn't start from a blank brief. Integrations with Shopify, Salesforce, HubSpot, Google Ads, Meta, and Snowflake remove the copy-paste handoffs between systems where errors and delays breed. Each removed handoff is a queue that can never form again.
6. Measure cumulative throughput, not single-launch heroics. Judge the program over six to twelve months of launches, not one fast campaign produced by weekend work. An append-only ledger recording actions, decisions, sends, and spending shows exactly which steps created delays and which approvals caught real problems. That record turns arguments about speed into arithmetic.
Two guardrails make the whole sequence safe. First, suppression runs inside the sending process, so speed never bypasses consent and a fast launch can't reach people who opted out. Second, agentic speed becomes safe only after limits and the ledger are in place. Automating a chaotic process produces chaos at scale, with better timestamps.
Configure the limits first, record everything second, and accelerate third. Teams that reverse that order spend the savings on corrections.
The One Action for This Week
Skip the transformation program. Take the longest wait from the last launch and name a decision owner for each approval step inside it. Then set a target in days saved for the next 30 days, small enough to be believable and specific enough to check.
Review median and p95 lead time monthly against the earlier baseline, and publish both numbers where the whole team can see them. Momentum in Time to Market Reduction doesn't come from a dramatic relaunch of the marketing department. It comes from one owned queue, shortened visibly, followed by the next one. Teams that string those wins together discover something encouraging: the calendar was never the enemy. The unowned handoff was, and that's fixable starting this week.
The AI CMO brings planning, content production, customer data, campaign execution, and reporting into one AI-native system, with configurable approvals, enforced suppression, and an append-only ledger keeping every accelerated launch accountable. For marketing teams ready to measure brief-to-live time accurately and shorten it without surrendering control, a visit to The AI CMO is the practical next step.
Share this article